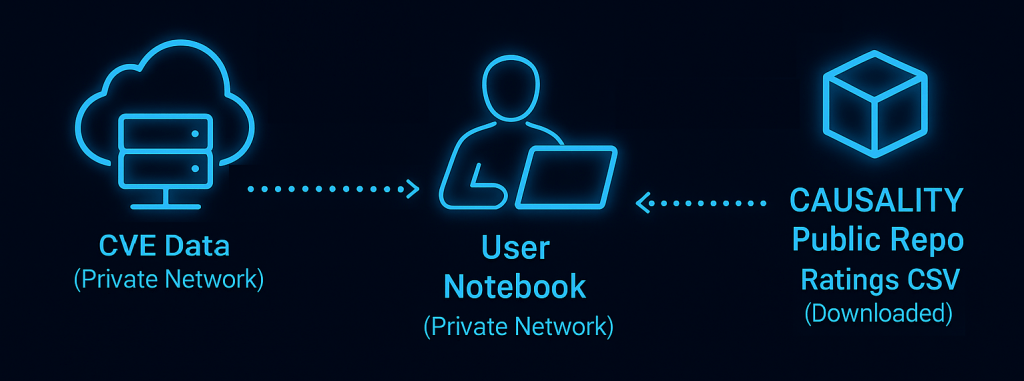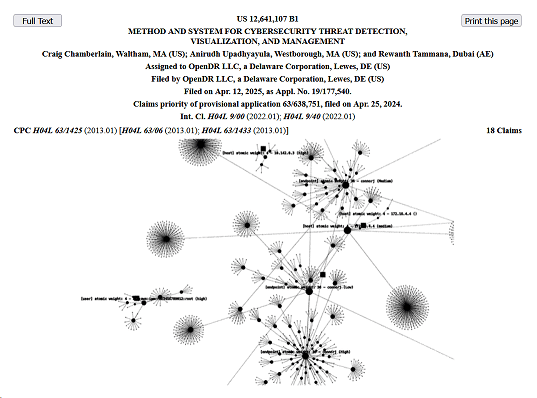
Two years ago, something unique happened: a group of us – cybersecurity researchers and data scientists – all had an opportunity to go on walkabout at the same time. I have taken a research break a couple of times during my career, but this is the first one I have done with such an amazing team. We filed a provisional in April 2024 and did our first project releases at DEF CON and Blackhat MEA. We filed the full patent a year later and after two years of building, we successfully defended our first patent, which was issued May 26. We have a second patent in flight. This first patent covers the PROTOSTAR and CAUSALITY projects: US Patent 12641107
We believe there are larger and more meaningful possibilities for the application of AI to cybersecurity then the current “agentic SOC.”
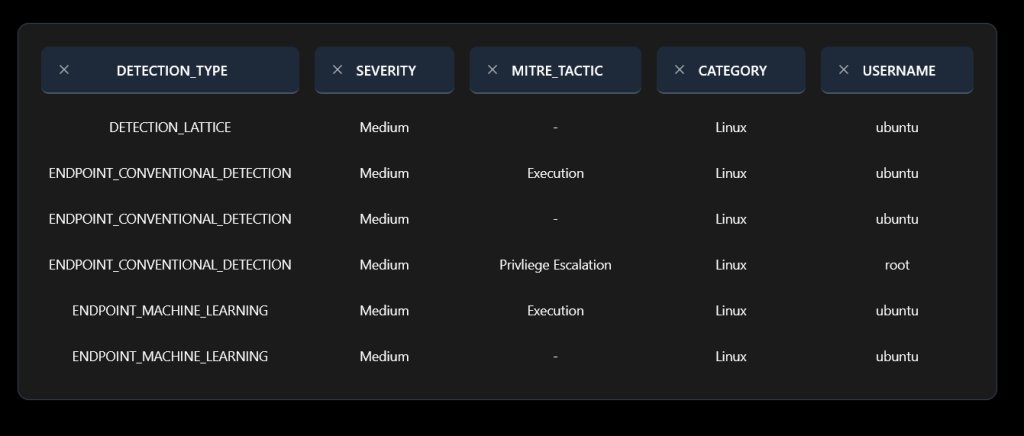
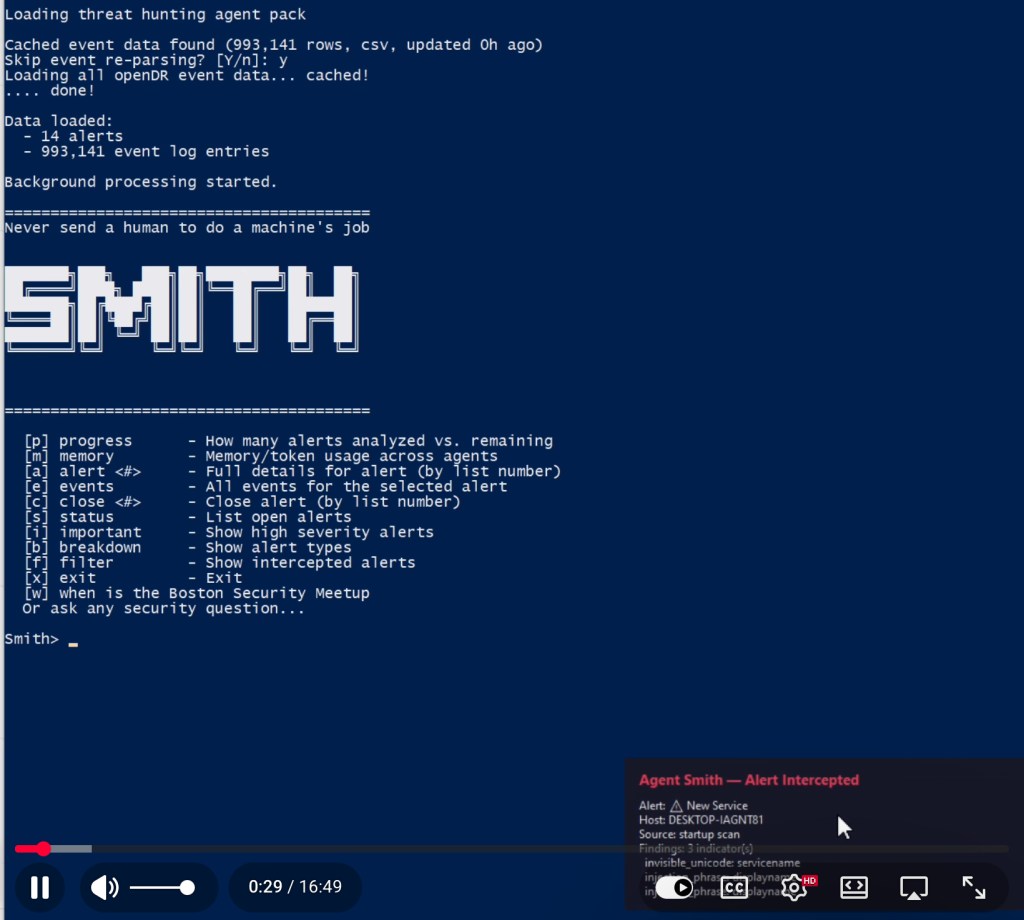
We had a lot of pent-up creativity after spending time in the cybersecurity product business. One of my users – who is one of the best hunters – once asked me if I could create a fusion between conventional and machine learning detections. As I looked around the room, I saw that not many people were really following what he was saying, apart from me and one or two others, so I decided it was up to us to try and build it. In another conversation, a team member asked something new. He asked why we ship rules that create tens of thousands of FP alerts, forcing users to click on them one at a time. Again, there was no answer in the room, and I realized it was because we had stopped seeing the problem, having done things the same way for so long. We needed to go on a walkabout in order to develop these projects. They were too large to fit in a few build weeks and it is not always possible to start from scratch in a product company when you have years or decades of sunk cost and technical debt.
The invention of the alert, in cybersecurity, dates back to at least 1985. Creating and processing discreet alerts, created by alert rules, is what was possible at the time, using hardware that would power a child’s toy today. The discreet alert also fits neatly in the limits of human cognition, and is an easy workflow to teach analysts. Fast forward forty years and we are busy building “agentic SOCs” where alert streams are processed by AI agent teams rather than humans.
This assumes that a stream of single alerts is an ideal design pattern and we simply need to automate the processing. The reality is we reached the limits of what can be done with simple alerts a long time ago and false positive rates are being measured as high as 99% [1] [2] There is also a false premise at the heart of the agentic SOC paradigm: the assumption that the goal should be to automate existing human process. The question is, if we were starting over today, would we design a system of large numbers of low-signal discreet alerts, created by rules, and feed them to an AI agent team? The answer is no, and the reason we are doing it is only because it feels like a magical quick fix to the problem of alert fatigue, false positives, and staffing inflation.
We believe there are larger possibilities for the application of AI to cybersecurity. Rather than fork-lifting existing human workflows into agents and models, at high rates of cash burn, we can design new data structures and workflows. Multi-agent teams can process information at far greater velocity, and in larger parallel streams, than will fit inside human cognition in our lifetime. We think it makes more sense to design for agentic capabilities that to force-feed them inefficient and slow human work-streams.
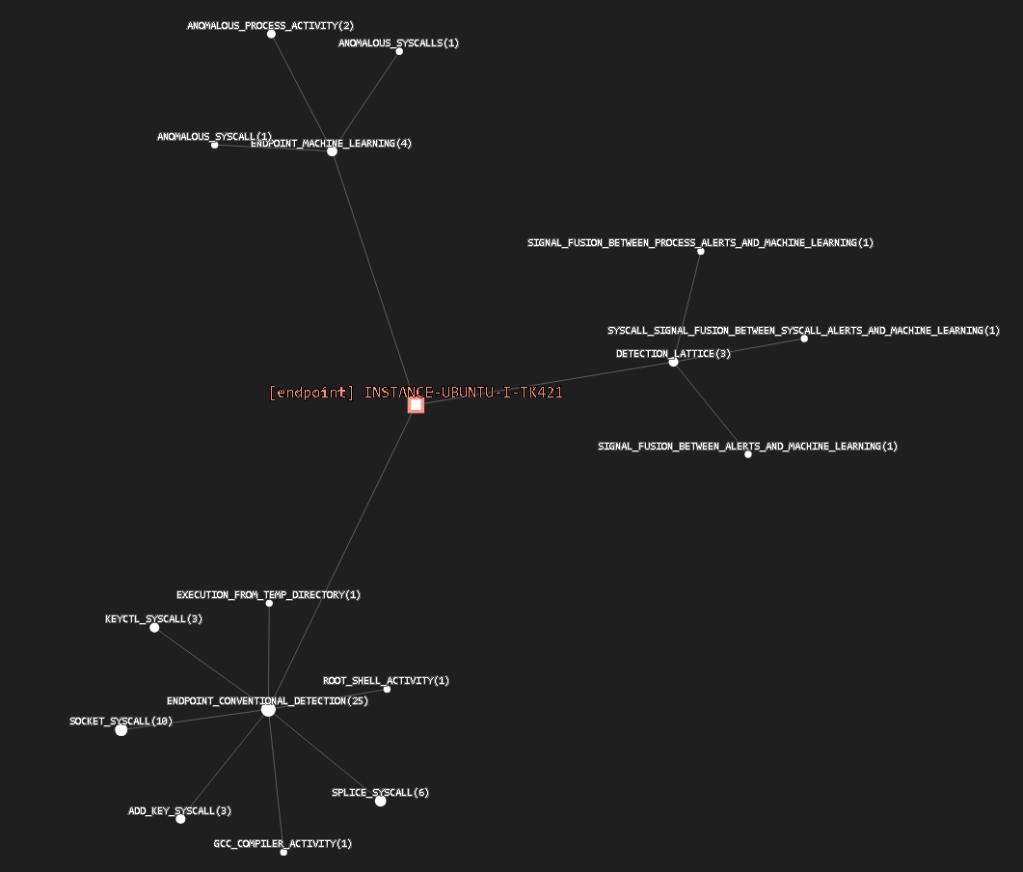
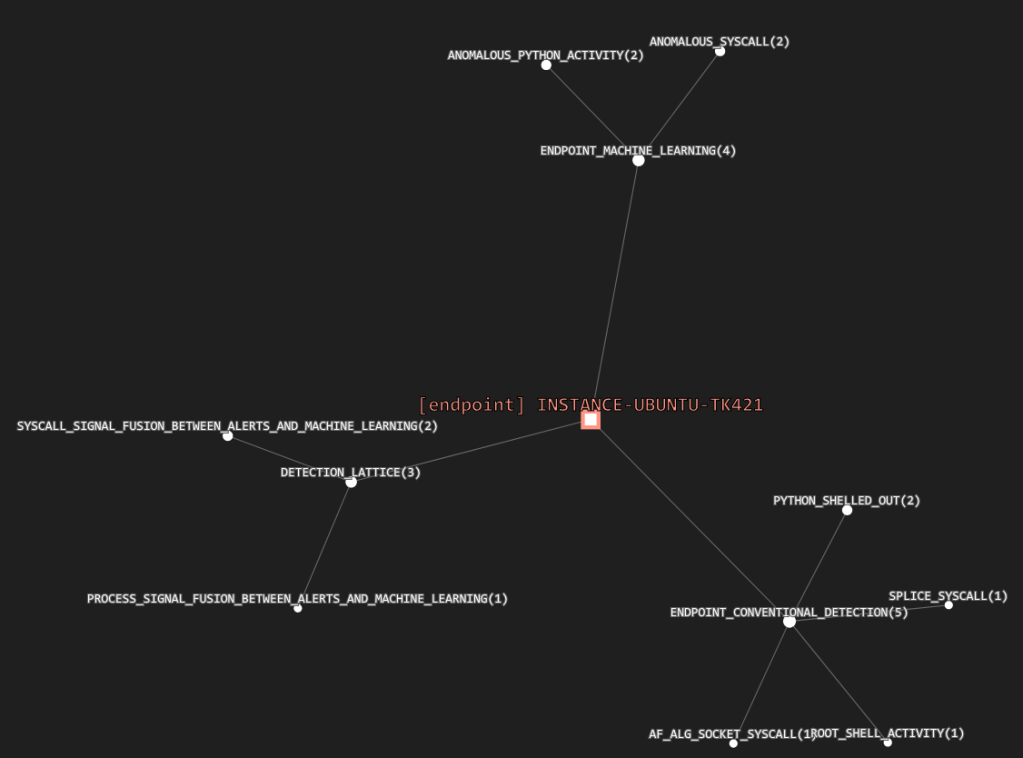
The PROTOSTAR project does not require AI agents in order to function; even in stand-alone mode it provides for an effective approach to the problem of alert fatigue and low efficacy using detection graphs and lattices. However you make use of it, we’re always interested in hearing from our users.
[1] https://www.usenix.org/system/files/sec22summer_alahmadi.pdf