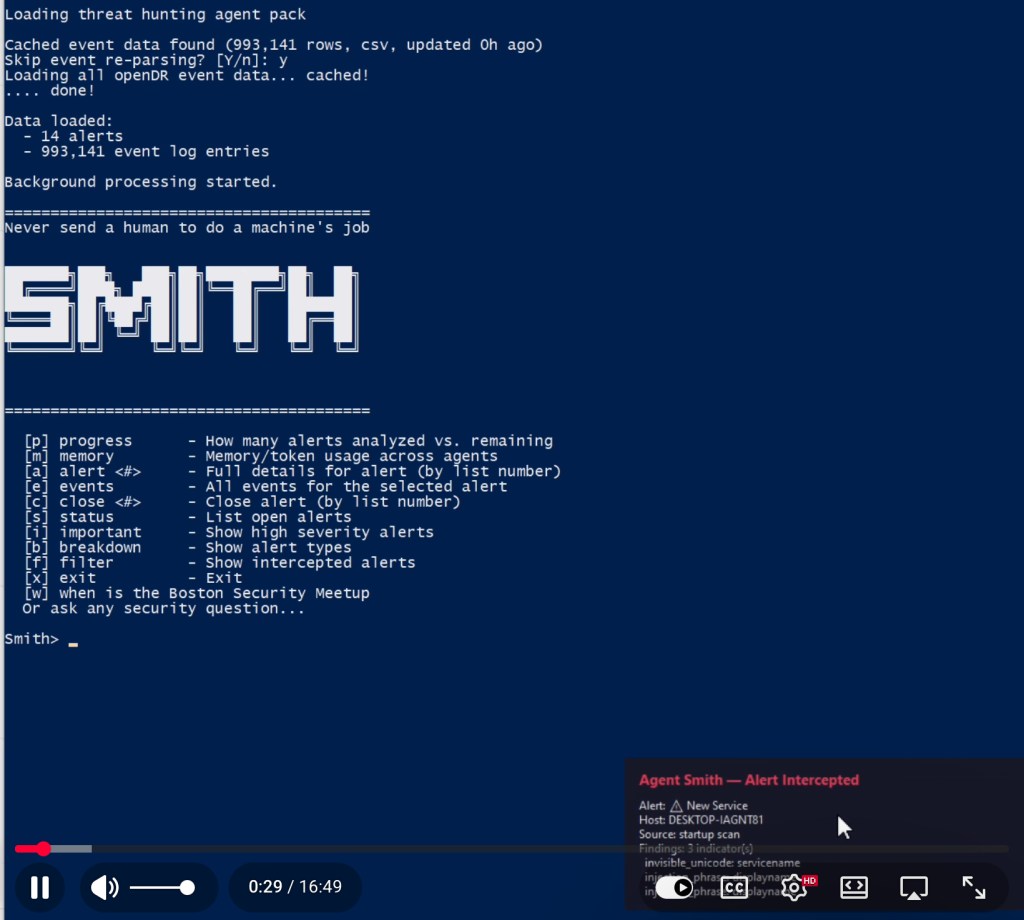
(originally code named “skynet” if you saw it at DEF CON or Blackhat MEA 2024)
Why do we ship products that create alert fatigue?
Three years ago, a team member asked that question. As is often the case when the best questions are asked, there was no clear answer from the room containing something like a millenium of assembled experience in the security product R&D. It left a lasting impression because we realized we had stopped asking that question. To the youngest team member, unencumbered by the weight of precedent, it was obvious. To us, it had become partly invisible, as we answered a stream of requests for short-term relief and quick fixes.
Alerts historically have been the result of a logical test, usually called a rule, outputting a boolean true / false decision on an input; something is either good or bad. The thing in question is usually a data blob comprising a log or email message. It could be an artifact from memory or a file system. The decision has to be made more or less immediately, using only the available input to the rule. Each true output is packaged into an alert for the users to read and the false outputs are mostly discarded. The problem is that too many of the things the rules say are bad could or should have been labeled good or benign. One way to look at this is that it is an issue of quality or tuning and the logical tests in the rules need refinement or additional branching logic; this leads to detection engineering. Another approach is to build complex post-processing systems that try to sort out the true and false positives using statistical analysis or machine learning. Both of these approaches, while often productive, create significant work streams for human analysts that are often incomplete due to their time and effort cost. The latest, and perhaps most fashionable approach is to use agents and large language models to offload the work of alert decisioning from the humans.
All of these approaches have one assumption in common: the assumption that we have to work with what we have, a list of alerts, a stream of relatively small discreet messages created by rules. This paradigm dates back to the first security systems of the 1990s when larger, more complex data structures were less practical. The alerts we have today are much more evolved, of course, but most of them are still a stream of Boolean true / false decisions on a small message, event, or data artifact. We have long known of the base rate fallacy and the sensitivity. specificity paradox. Alert rules, like people, cannot be in two places at the same time. A single rule can be optimized to minimize false positives, or to maximize true positives, but not both at once.
Imagine a criminal trial where each piece of evidence, from the case, is shown to a single juror, who then makes a decision. The next piece of evidence is shown to another juror, who makes a decision based on that. There would be different verdicts from the jurors with some returning guilty or not guilty as best they could decide from what they were shown. A good number of them might return no decisions, citing insufficient information to form the basis for a decision. However we calculate the final verdict, after tallying the votes, we can easily imagine how inaccurate this would be, given the difficulty of making such a large decision from a single piece of information. We would never do this, in real life, but the analysis of individual alerts, one at a time, by security teams today, can be likened to this.
what would we do if we had a blank slate? score the graphs, not the alerts
If we were going to do something different, what would it look like? One option is to plot alerts on graphs instead of putting alerts into tables. Plotting masses of alerts on graphs has been done, but a simple alert graph will quickly become overloaded beyond readability. Drawing alerts, in a graph, doesn’t necessarily have more information gain than a conventional list format. There is more untapped information in the graph, however, in the form of relationships. Most entities – endpoints, servers, roles and users – in such a graph don’t have relationships with most of the others, so putting everything in one graph can again have low information gain and high density.
Suppose we make a series of graphs instead; a separate graph for each entity, with each entity at the center, and the detection artifacts – alerts created by rules and by machine learning models – are the edges. Call each detection type a relationship, and add booster relationships for the entities with multiple detection relationships. Add another boost for detection relationships where different detection types agree on the same original input. Two or three witnesses are better than one. Add additional boosts for complementary ATT&CK tactics, machine learning based recommendations, agentic analysis, or local user sentiment. Now, instead of scoring the alerts individually, we score the the detection graph for each entity in the graph, not relying on the scores or severities of the alerts themselves, but instead using the signal strength of the number and strength of the detection relationships in the sub-graph for the entity. Next up: some examples of how this is better solution, at lower cost, to alert fatigue.